Figure 1 2372380 displays the Model Calibration tab that provides access to some of the calibration features available in EFDC_Explorer. The There are six types of calibration that may be generated:
- Time Series Comparisons,
- Correlation Plots
...
- ,
- Vertical Profile Comparisons
- High Frequency Time Series
- Flux Comparisons
- Cruise Plot Comparisons
For each of these the user can provide a linkage of water column model results to measured data. Once the model/data linkage has been defined once, calibration plots and statistics can be quickly generated after each model run.
Once defined, calibration plots and statistics may be generated automatically by selecting the Generate Now button, or the selecting the Generate Calibration Plots and Statistics checkbox in Run Options before running a model. It should be noted that if a new model is opened while the current model is running that plots and statistics will not be automatically generated.
Pressing a Plots button allows the user to review the plots on screen and set each plot's plot’s style. Before viewing the plots the user will be prompted as to whether they want to Automatically Generate Defined Plots If the user selects this option then EE will save the plots to the project directory into a folder entitled #calib_plots. If the user selects Automatically Export ASCII Data for the Defined Plots the .DAT files are saved into a folder entitled #calib_extraction.
To generate the statistics, select the Generate Now button and check the error statistics to be reported. Selecting Ok will start the calculations. This can take several minutes for large models. For this reason, the user can select the Start Run Timer button which will show the type of plots that EE is generating at that time in the End of Run Timer. Once the statistics are displayed, the user can save to a text file or copy to clipboard
| Anchor | ||||
|---|---|---|---|---|
|

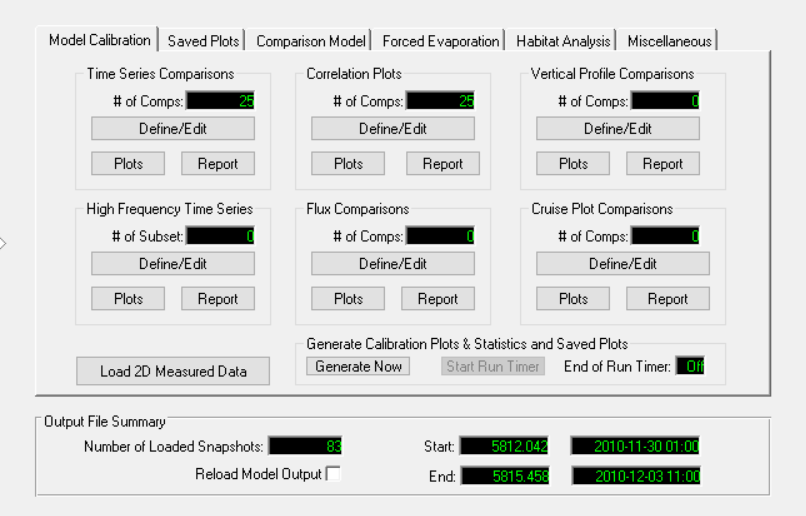
Figure 1 Post Processing Options - Main Form.
...
The time series, correlation and vertical profile model-data linkages provided in this section are only one means of conducting model-data comparisons. Almost any model parameter can be compared to data using the Import Data feature of the time series plotting utility. See Section 9 See Time Series Graphing for more details.