...
This guidance will take the demo model DM-13 as an example because it is available on EEMS resources. The instruction is mostly presented in the EEMS 3D View.
Generate DEM file
...
Load the DM-13 model, open the 2DH View, select Generate DEM option from the Layer Control as shown in Figure 1.
...
Once the option is selected, the Generate DEM form will appear as shown in Figure 32. From this form, the user click on Add File then browse to the digital elevation data file (terrain*.xyz) from Data folder. Once loaded, the coordinates of the Lower-Left and Upper-Right points will be updated as well as the Cell Size and Number of Cells, the user can change the Cell Size then click on the Calculator symbol to update the Number of Cells and vice versa. the The more number of cells the higher resolution of the DEM file. The output format for the generated DEM files is TB2, click the Generate DEM button to start generating DEM file.
Anchor Figure 2 Figure 2

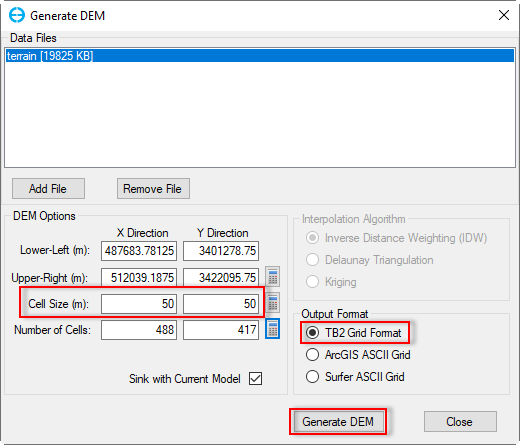
Figure 32. Generate DEM form.
Once, the Generate DEM button is selected, the Export DEM form is displayed as shown in Figure 4. Enter a name in the File Name (e.g Generated DEM), select the folder directory to store the file then click Save button as shown in Figure 4. When DEM file generation done, a informing message will be popped up as shown in Figure 5. Click OK button to exit the form.3.
Anchor Figure 3 Figure 3 Anchor Figure 4
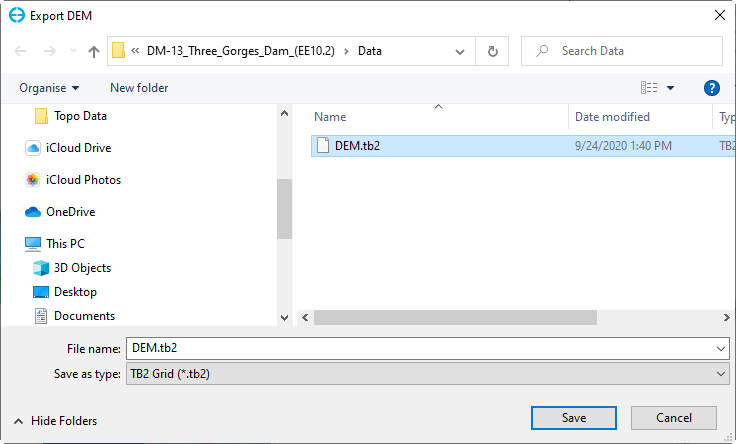
Figure 43. Export DEM to a file.Anchor

Figure 5. DEM generated completed.
Load a DEM file in 3D View
Open the 3D View, click the Import External Layer in the Layer Control. The Open External Layer form will be displayed. Select the DEM data file from drop-down list next to the File Name box as shown in Figure 64. Select the DEM file .tb2 in the Data folder then click Open button. The DEM layer will be added to the Layer Control and displayed as Figure 75.
6Anchor Figure
64 Figure 4

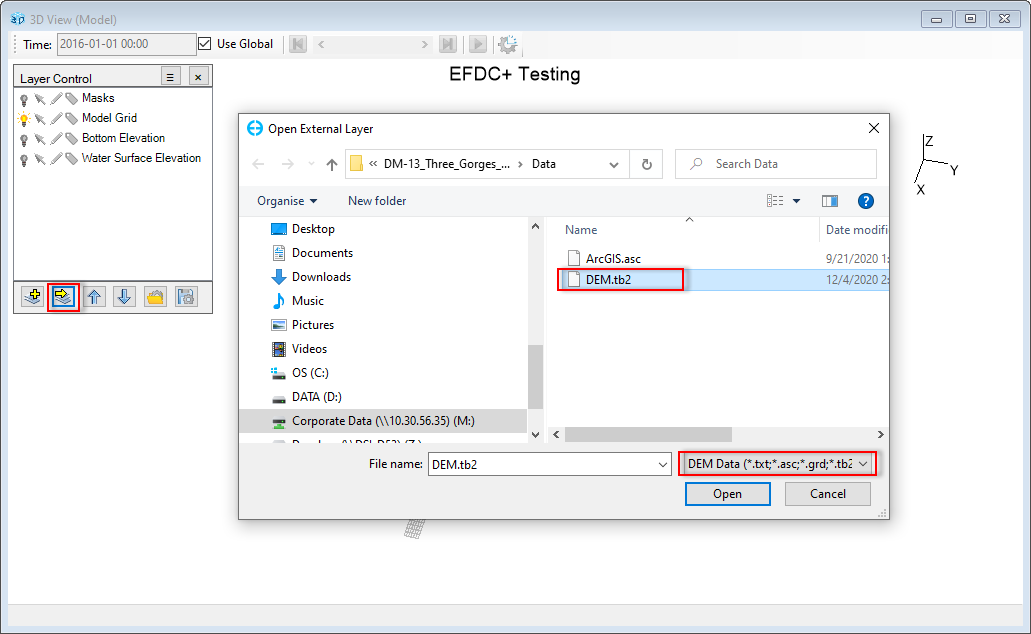
Figure 64. Import DEM file.
7Anchor Figure
75 Figure 5

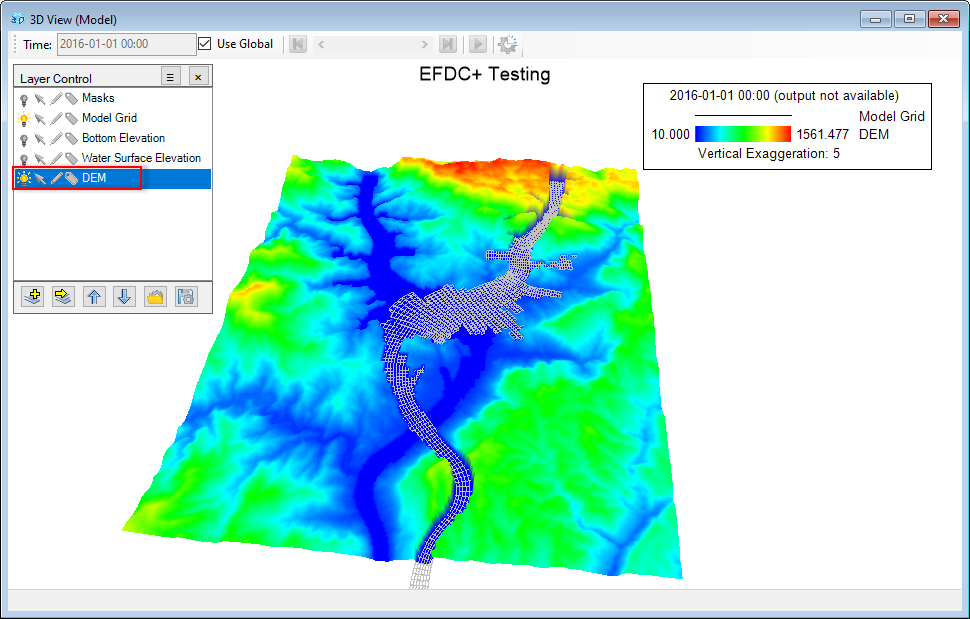
Figure 75. DEM displayed in 3D View.
...
.png?version=1&modificationDate=1607054211639&cacheVersion=1&api=v2)
...
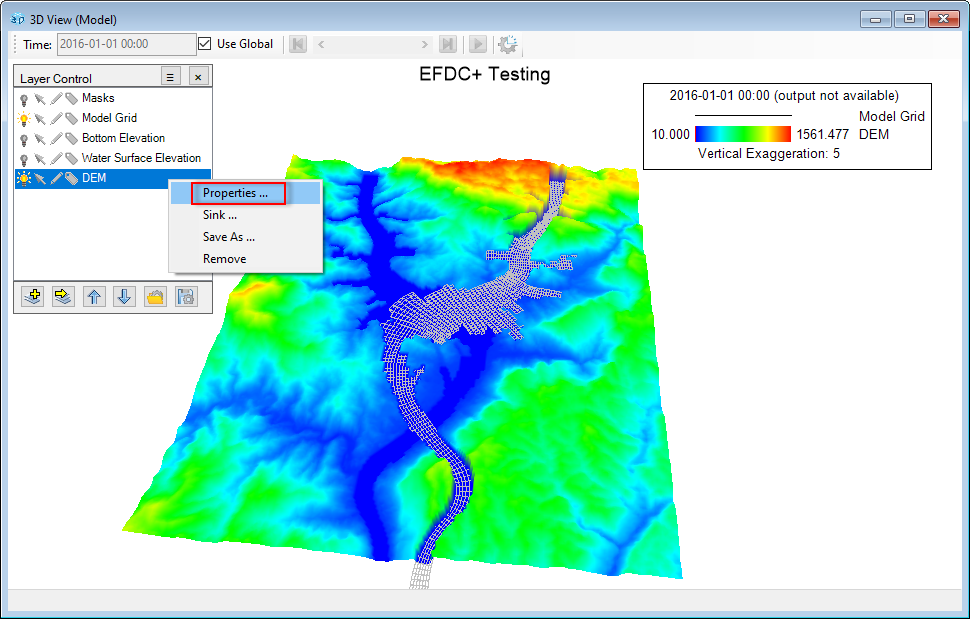
The user can adjust vertical exaggeration to having a better view by changing the Vertical Scale Modifier in the form of 3D View Settings by RMC on the legend as shown in Figure 8. to set the DEM’s properties by RMC on this layer in Figure 5 shows the model grid is not fit to the DEM. To fix this issue, RMC on the DEM layer on the Layer Control, then select Properties option as shown in Figure 9.
...
6. The DEM Layer Properties form will be appeared as shown in Figure 7, click on Flip button then click OK button.
9Anchor Figure
96 Figure 6
.png?version=1&modificationDate=1607054211245&cacheVersion=1&api=v2)
Figure 9. DEM properties.
10Anchor Figure
107 Figure 7

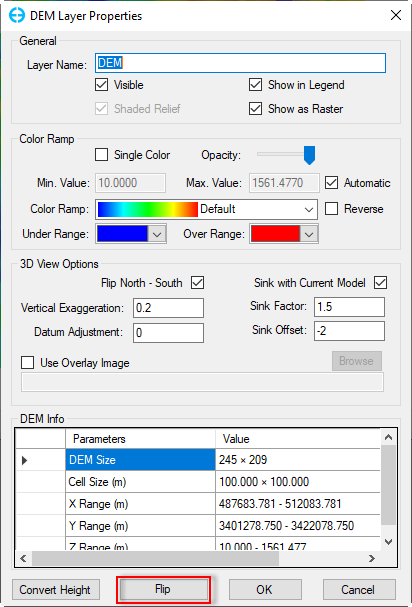
Figure 107. DEM properties.
Figure 10 shows DEM Layer Properties form. There are a number of options from this form as described below:
General frame
Layer Name: this allow to enter a name for the DEM layer. This name will be updated on the Layer Control and the legend as well.
Visible: turn on/off the DEM layer for view.
Shaded Relief: to represent the DEM on maps in a natural, aesthetic, and intuitive manner.
Show in Legend: to show on/off the DEM layer in the legend.
Show as Raster: to show the DEM layer as raster.
Color Ramp frame
Single Color: this option allows to display the DEM as a solid color.
Opacity: to adjust the transparency level of the DEM layer.
Min. Value, Max. Value: when the Automatic box is unchecked, the user can enter a Min and Max values.
Color Ramp: Optional selection of color ramp set for DEM from the drop-down list.
Reverse: Reverse order color ramp.
Under Range: Set color for value less than the Min value.
Over Range: Set color for value greater than the Max value.
3D View Options frame
Flip North - South
Sink with Current Model
Vertical Exaggeration: to adjust vertical scales.
Datum Adjustment: Enter a positive number to raise up the DEM and a negative number to lower the DEM.
Sink Factor:
Sink Offset:
The user can adjust vertical exaggeration to having a better view by changing the Vertical Scale Modifier in the DEM Layer Properties form as shown in Figure 7 and in the form of 3D View Settings by RMC on the legend as shown in Figure 8.
Anchor Figure 8 Figure 8
Figure 8. 3D View Settings.
Use Overlay Image
This option allows to use geo-referenced map (e.g Google satellite image) to cover the surface of the DEM. Checked on box of Use Overlay Image then click Browse button to browse to the geo-referenced image as shown in Figure 119, select map_geo.jgw file in the Map-Images folder then click Open button and result is shown in Figure 12.
DEM Info: display general information of the DEM file as DEM size, cell size, X, Y and Z range.
The Convert Height allows to convert height of the DEM from the current unit (e.g meter) to other unit (e.g foot). When this option is selected, the DEM Height Conversion form will appear as shown in Figure 13. Click the Convert button on this form then click the OK in the Figure 10 to implement conversion. The new color ramp range for DEM will be updated on the legend.
The Flip button allows to adjust the grid fit to the DEM.
Anchor Figure 119 Figure 119

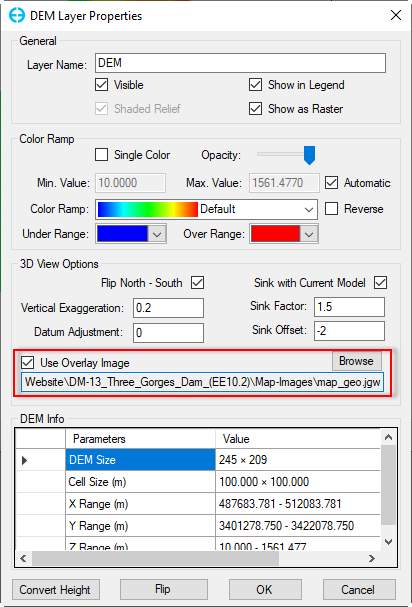
Figure 129. Open Use Overlay imageImage option.
Anchor Figure 1210 Figure 1210

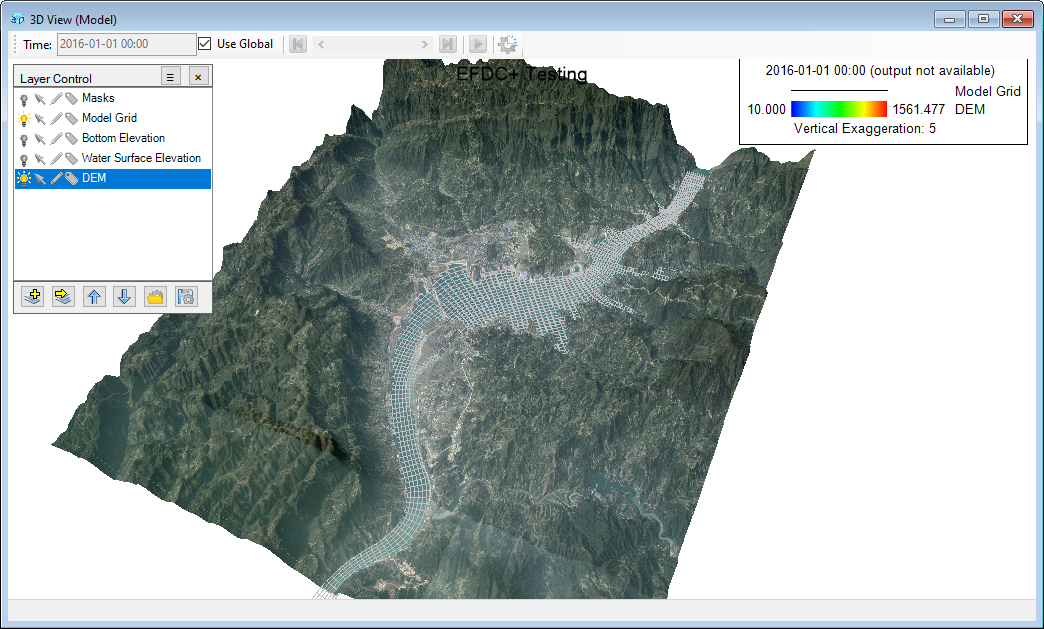
Figure 1210. DEM covered with a satellite image.Anchor

Figure 13. DEM height conversion.